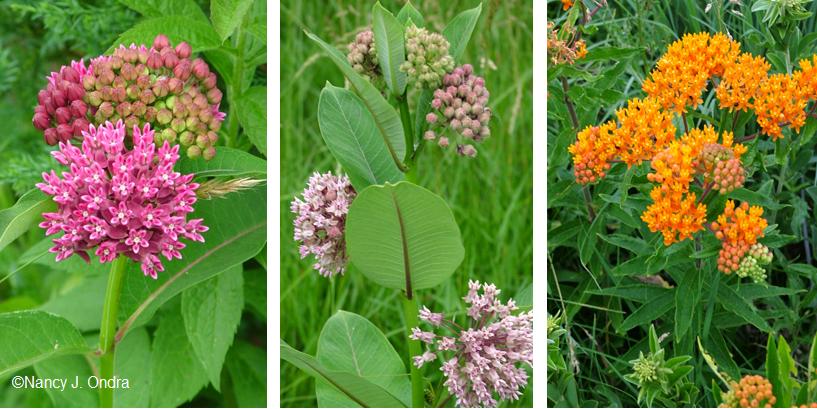
Asclepias purpurascens (CC 6), A. syriacus (CC 1), and A. tuberosa (CC 6)
I consider myself a plant geek, and somewhat of a computer geek, but a math geek I’m definitely not. Numbers are not my friends. Generally, that’s not a problem in the mostly non-numeric world of gardening. Apart from having to remember a few simple measurements and conversion factors, I figured I’d be free of complicated math after college. So I was appalled when I first heard about the Plant Stewardship Index (PSI): a system for quantifying the “naturalness” of a piece of land. The idea of assigning numeric values to plants, adding them up, and running them through esoteric formulas seemed at first glance like a bunch of bureaucratic nonsense. Within the first few minutes of hearing it explained in a lecture at the Millersville Native Plants in the Landscape conference a few years ago, though, I was totally hooked by the idea.
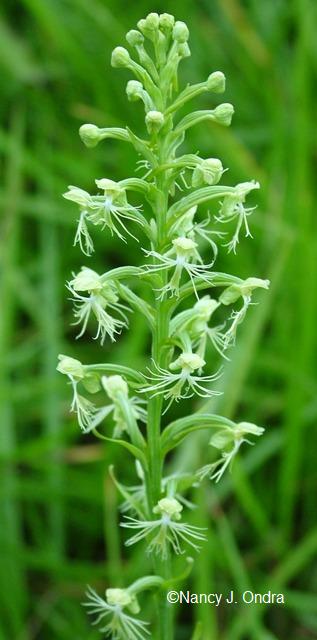
Platanthera lacera (CC 4)
Prior to that experience, I thought I had a fair grasp of judging a property’s vegetation – particularly the woodlands and meadows I often ramble through. If they contained the native plants I expected to see there, that was good. If I found something uncommon, like ragged fringed orchid (Platanthera lacera), that was really good. If I found non-natives, that wasn’t so good. And if I saw invasive exotics like burning bush (Euonymus alata) and Japanese barberry (Berberis thunbergii), that was bad.
The PSI is based on a rather different premise. It assigns a numeric Coefficient of Conservatism (CC) rating from 0 to 10 to each plant, based on how dependent that plant is on a specific habitat, rather than on its rarity or on its potential to be invasive. No matter how notoriously “bad” a plant is, the lowest rating it can get is 0: the same as any plant that isn’t native to the area. Plants ranked 1 to 3 are natives that can adapt to a wide range of growing conditions. Red maple (Acer rubrum var. rubrum) and giant ragweed (Ambrosia trifida), for example, are both rated 1 in my part of Pennsylvania. Because species like these are so adaptable, finding them on a particular site doesn’t tell you much about how that habitat has been affected by human intervention.
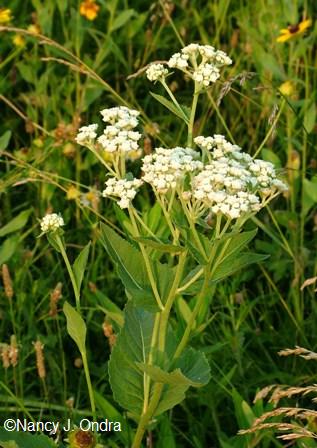
Parthenium integrifolium (CC 10)
Plants with higher ratings are more picky about their growing conditions, with 10 indicating that a plant is likely to occur only in sites where humans haven’t been active. Scanning the list for 10s finds some “of courses”, like the large white lady’s slipper orchid (Cypripedium reginae), but also some surprises, such as dwarf crested iris (Iris cristata). Some other high-rated plants that are familiar to us gardeners include foamflower (Tiarella cordifolia) at 8, sweet pepperbush (Clethra alnifolia) at 8, and white boltonia (Boltonia asteroides var. asteroides) at 9: seemingly high ratings for plants that we could find at pretty much any garden center. Sea oats (Chasmanthium latifolium), which can seed around freely enough in gardens to be considered aggressive, rate a 7. Leatherflower (Clematis viorna), which has grown happily in one of my borders for years, would rate a 9 if I found it growing in the wild. But the terrestrial ragged fringed orchid, which I was so excited to find in my meadow, is only a 4.
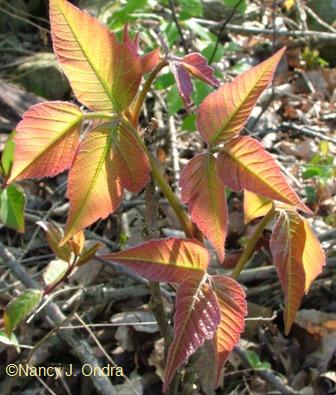
Toxicodendron radicans (CC 1)
This is what makes the CC rankings so different from what we – or at least I – valued before. They’re not saying “these plants are common, so it’s no big deal if we clear this site for a development” or “these plants are rare; we have to protect them.” They reflect the site’s value as an entire botanical habitat, which becomes an amazingly valuable tool for land-use planning. None of us want to see yet another field become a parking lot, of course, or a bit of woodland be bulldozed for a housing development. But it’s going to happen, and if you could tell that one piece of land was already degraded by human influence and another was remarkably pristine, it’s pretty clear which one would be worth fighting to save.
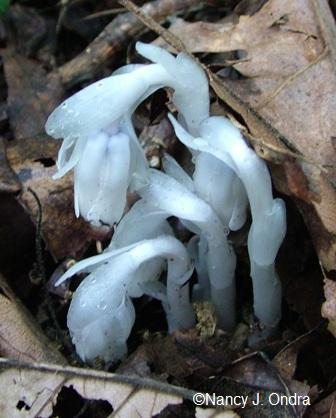
Monotropa uniflora (CC 4)
I should explain that the presence of just one or two high-rated plants doesn’t tell the whole story. First, an inventory of the site is done to identify as many plants as possible. (The more known plants, the better, obviously, but apparently you can get a decent reading from just 40 percent or so.) The CCs are determined by referring to a database, added together, and further computed to provide two different numbers: the Floristic Quality Assessment Index (FQAI) or Floristic Quality Index (FQI), which is based only on the native plants, and the Plant Stewardship Index, which considers both the natives and non-natives.
A one-time evaluation can tell a tremendous amount about the botanical value of a given site. Repeating the evaluation over a period of years is even more informative, and it’s invaluable as a tool for judging how a site is improving or degrading. If you make an effort to eradicate the non-natives, for example, the PSI could increase; if you neglect or actively disturb the property (by clearing part of it, for instance, or mowing weekly instead of yearly), the PSI could go down.
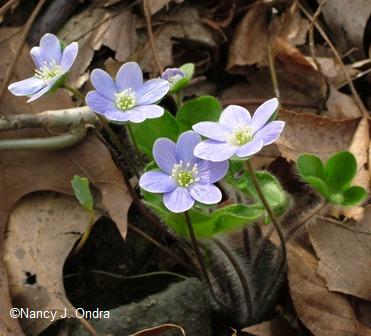
Hepatica nobilis var. obtusa (CC 5)
So what does this all have to do with our home gardens? Not much, to be honest. But I know from reading your own blogs that many of you are just as interested in the environment beyond your own backyard: that you enjoy visiting natural areas, and that you care about native plants. Discovering this new way of looking at habitat value has been fascinating to me, and I hope it’s of interest to you too.
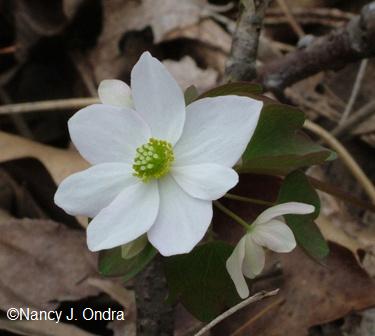
Thalictrum thalictroides (CC 6)
Now, I have to tell you that the PSI program I’m familiar with is currently only for the Piedmont region of Pennsylvania, as well as all of New Jersey, though I understand that botanists are working on assigning CCs to plants in other parts of Pennsylvania as well. Some other parts of the country have similar programs; you may be able to find one for your region by Googling “floristic quality”. Or, check out our local program, hosted by Bowman’s Hill Wildflower Preserve. They offer educational programs on plant identification and the basics of the PSI for individuals and groups who are interested in land management, as well as professional botanical surveys and plant ID services for those who’d rather leave it to the pros. If you’re interested in seeing the details of how the FQAI and PSI are calculated, along with the entire list of CCs for thousands of plants, click here. Or, look up individual plants in their online database.
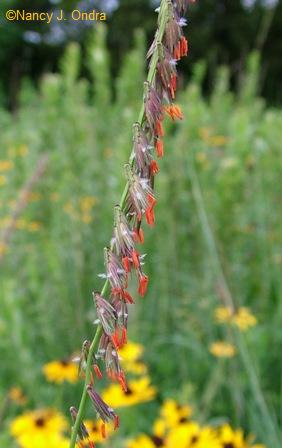
Bouteloua curtipendula (CC 9)
My favorite part of the site is the online PSI Calculator. I set up an account there (it’s free) and created a list of the plants I’d identified on my parents’ farm, and it automatically calculated our FQAI (33.7) and PSI (25.07). Our CCs range from 0 to 8, with an average of 3.49 for the natives. When I’m ready to do an update (hopefully this summer), I can easily create a new list based on the existing one, so I can compare it with the first one to see what, if anything, has changed over the last 2 years. Best of all, I can also see lists that others have created to compare our FQAI and PSI with theirs, see what sorts of plants they’ve found, and even send them questions or comments about their lists. Very cool! It’s enough to make me think that plants and numbers aren’t such a bad mix after all.
